MACD Indicator Explained: Trend Momentum for Trading Bots
MACD indicator explained in plain language: what it measures, the four signals it gives, where it fails, and how to use it inside an automated no-code bot.
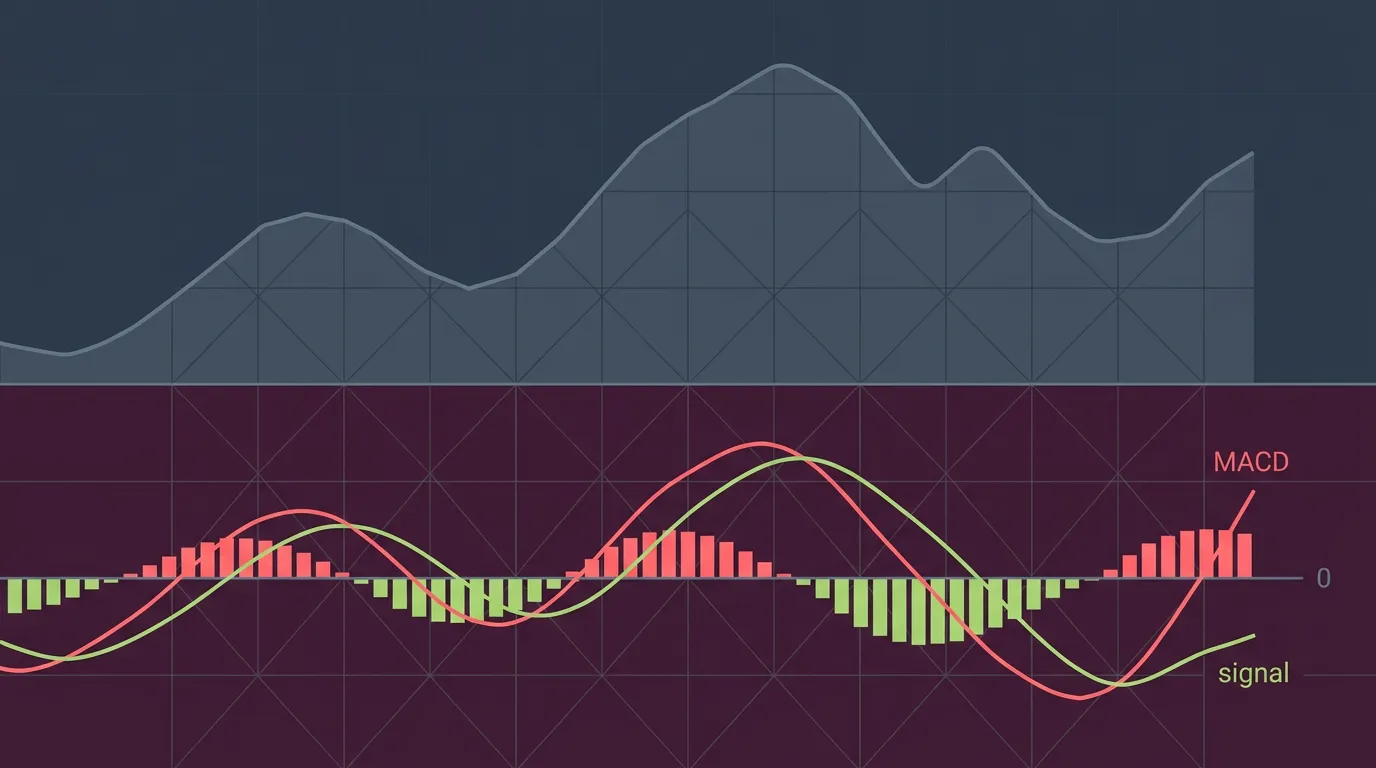
What MACD actually measures
MACD (Moving Average Convergence Divergence) tracks the distance between two exponential moving averages — classically a fast 12-period EMA and a slow 26-period EMA. When the fast average pulls away from the slow one, momentum is building. When they converge, momentum is fading.
It has three parts:
- MACD line — fast EMA minus slow EMA. Positive means the short-term trend is above the longer-term one.
- Signal line — a 9-period EMA of the MACD line. A smoothed version used as a trigger.
- Histogram — MACD line minus signal line. It shows how fast the gap is widening or shrinking.
MACD is not an overbought/oversold gauge like RSI. It has no fixed upper or lower bound — it measures the rate of change of trend, not extremes.
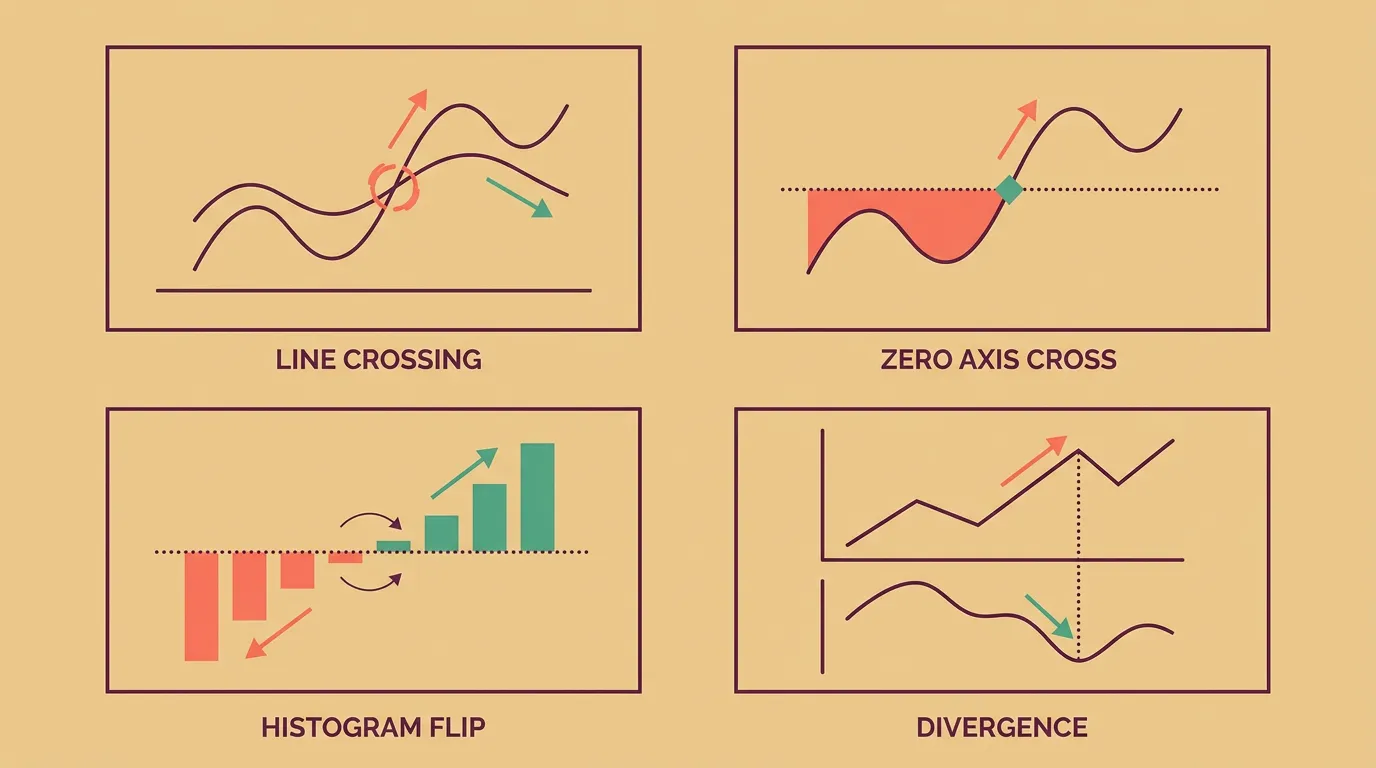
The four signals traders read
Signal-line crosses fire the most often and produce the most false starts. Zero-line crosses are slower but filter out much of the chop. Many automated strategies combine them: only take a bullish signal-line cross while MACD is above zero, so you are trading with the broader trend rather than against it.
Where MACD fails
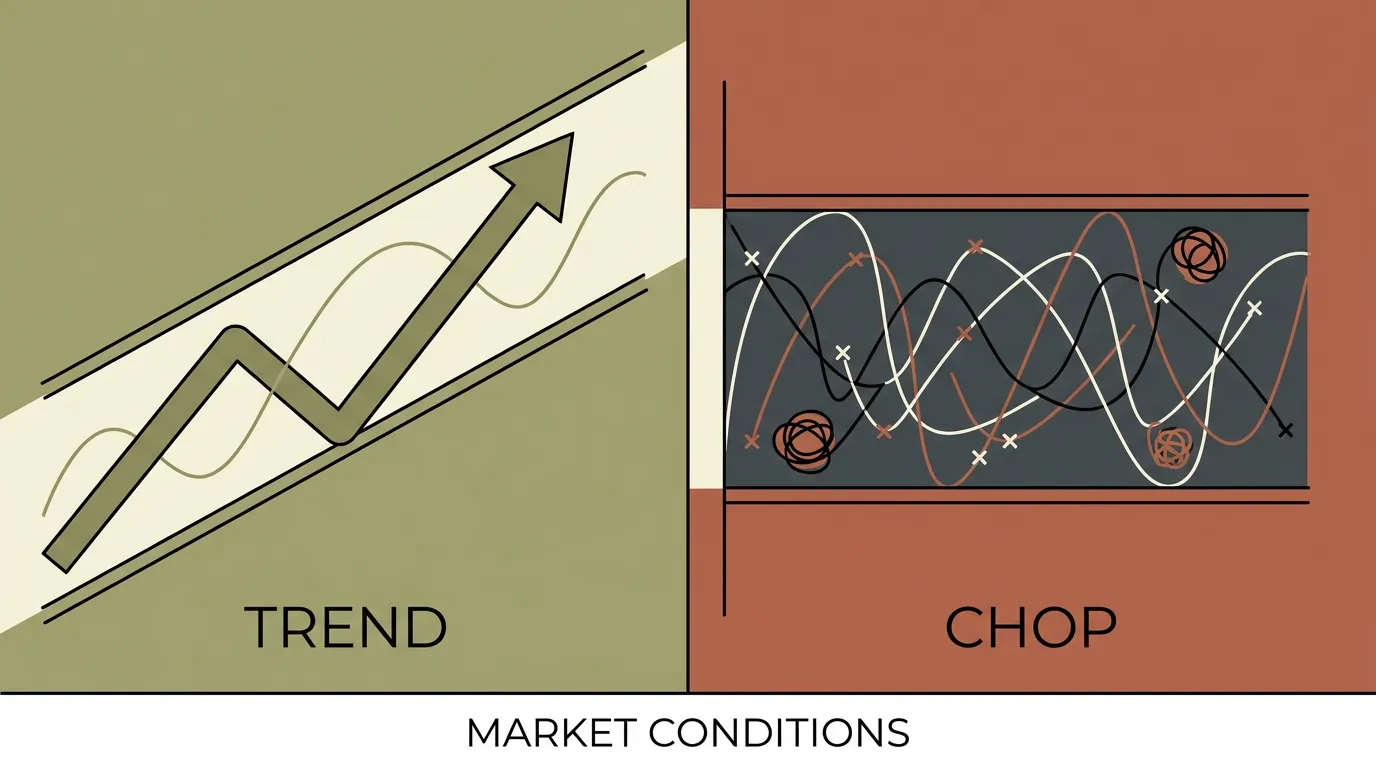
MACD is built from moving averages, so it inherits their weakness: it lags, and it whipsaws in sideways markets. In a range, the two EMAs keep crossing each other and the histogram flips repeatedly — a bot trading every cross will bleed on fees and slippage.
Three practical limits worth knowing:
- No absolute scale. A MACD value of 40 on one asset means nothing on another. You cannot set universal thresholds the way you can with RSI's 30/70.
- Divergence is unreliable alone. Strong trends produce divergence for a long time before anything reverses.
- The 12/26/9 defaults are conventions, not laws — but changing them invites overfitting. Test any change with .
Crosses can flicker while a candle is still forming. Have your bot act on closed candles only, or you will chase signals that vanish before the bar ends.
Using MACD inside a no-code bot
On algomax you never touch formulas — you describe the logic in plain language and the AI assistant turns it into a ready-to-run bot. In practice that means writing something like: "On the 4-hour chart, buy when the MACD line crosses above its signal line while MACD is above zero; exit when it crosses back below or price hits a stop set from recent volatility."
A few design choices that matter more than the indicator itself:
- Pick one job for MACD. Use it as an entry trigger or as a trend filter for another signal — not both.
- Pair it with a non-correlated input. MACD plus another moving-average system tells you almost the same thing twice; volume or volatility adds real information.
- Define the exit explicitly. The opposite cross is a valid exit, but it gives back a lot of an extended move. Consider alongside it.
- Add a regime guard. Because MACD chops in ranges, many traders gate it behind a trend-strength condition.
MACD complements bounded oscillators nicely — where the , MACD measures momentum direction. Then , with realistic fees included.
Key takeaways
- MACD measures the gap between a fast and slow EMA — trend momentum, not overbought/oversold.
- The four readings are signal-line crosses, zero-line crosses, histogram turns and divergence; combining two filters out noise.
- It lags and whipsaws in ranges — pair it with a trend or volatility filter.
- In a no-code bot, describe the cross condition in plain words, act on closed candles, and validate on out-of-sample data before risking real money.
Frequently asked questions
What do the 12, 26 and 9 settings in MACD mean?
They are the periods of the fast EMA, the slow EMA and the signal line respectively. They are long-standing conventions rather than optimal values, and changing them without out-of-sample testing usually just overfits your backtest.
Is MACD better than RSI?
They answer different questions. RSI is a bounded oscillator that flags momentum extremes, while MACD is unbounded and describes the direction and speed of a trend, so many traders use one as a trigger and the other as a filter.
Does MACD work in sideways markets?
Poorly. In a range the fast and slow averages repeatedly cross, generating frequent false signals that erode returns through fees and slippage, so most automated setups gate MACD behind a trend-strength or volatility condition.
Can I use MACD in a bot without writing code?
Yes. On algomax you describe the condition conversationally, such as buying when the MACD line crosses above its signal line while above zero, and the AI assistant turns that into a ready-to-run bot you can backtest and deploy.
What is MACD divergence?
Divergence is when price makes a new high or low but the MACD does not confirm it, suggesting the move is losing thrust. It is a warning sign rather than a standalone entry, since divergence can persist for a long time in strong trends.